Observing Cluster Traffic
Cilium provides an extension called Hubble.
Much like the space telescope of the same name, Hubble is specialized in observability.
With the Hubble UI the entire traffic in the cluster can be visualized graphically.
Alternatively, the powerful hubble CLI can be used to identify problems more quickly.
Hubble Installation
In NETWAYS Managed Kubernetes clusters that use Cilium as the CNI, the Hubble UI is already installed.
Web UI
To gain access to the web UI, you need to forward traffic to the Hubble UI service into the cluster. This is done with the following command:
Afterwards you can open the Hubble UI locally in your browser at 127.0.0.1:8080.
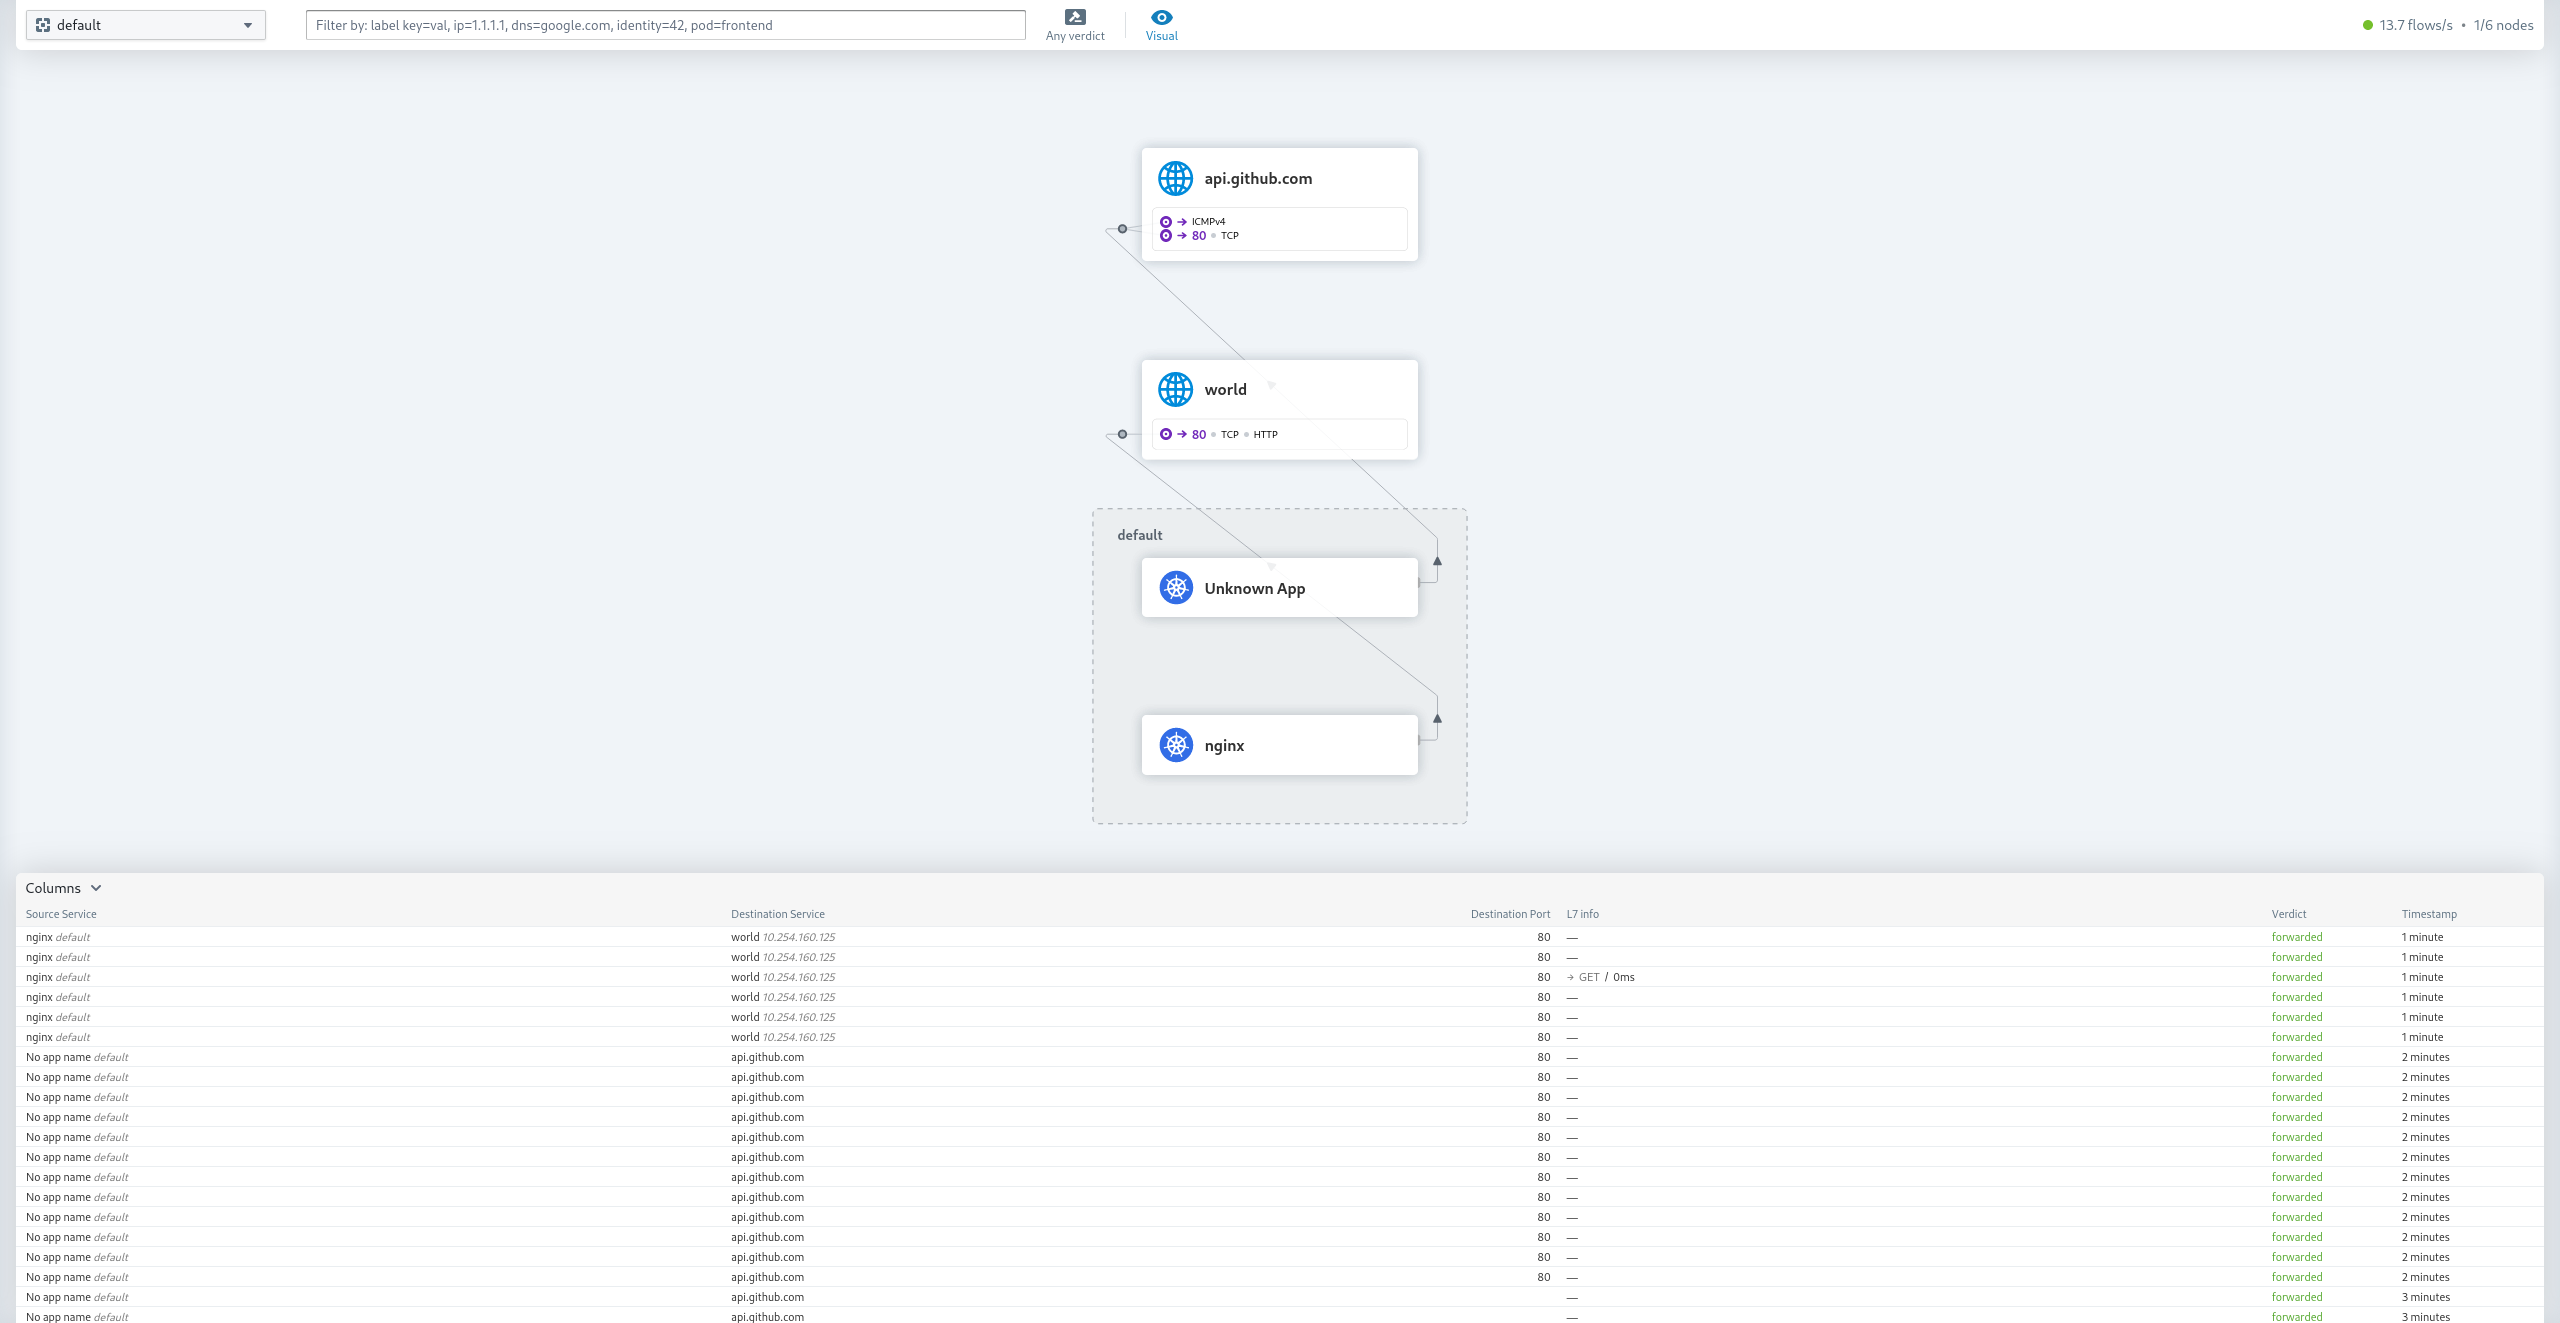
In the upper left corner of the UI there is a dropdown list with all defined Namespaces.
After selecting a Namespace, a session is started that observes all traffic within that Namespace. To examine a specific Pod more closely, you can either click it directly or set a filter in the search bar.
CLI
To use the hubble CLI you either have to install it locally or work from the Cilium container inside the cluster.
Local Installation of the hubble CLI
HUBBLE_VERSION=$(curl -s https://raw.githubusercontent.com/cilium/hubble/master/stable.txt)
HUBBLE_ARCH=amd64
if [ "$(uname -m)" = "aarch64" ]; then HUBBLE_ARCH=arm64; fi
curl -L --fail --remote-name-all https://github.com/cilium/hubble/releases/download/$HUBBLE_VERSION/hubble-linux-${HUBBLE_ARCH}.tar.gz{,.sha256sum}
sha256sum --check hubble-linux-${HUBBLE_ARCH}.tar.gz.sha256sum
sudo tar xzvfC hubble-linux-${HUBBLE_ARCH}.tar.gz /usr/local/bin
rm hubble-linux-${HUBBLE_ARCH}.tar.gz{,.sha256sum}
For the local hubble CLI to be able to access information from the cluster, you need to grant it API access:
kubectl port-forward -n kube-system svc/hubble-relay 4245:80 &
Forwarding from 0.0.0.0:4245 -> 4245
Forwarding from [::]:4245 -> 4245
Using the Hubble Container in the Cluster
Instead of a local installation of the hubble CLI you can also work directly in the Cilium container in the cluster. For this you can set up an alias:
alias hubble='kubectl exec -in kube-system ds/cilium -c cilium-agent -- hubble'
hubble status
    Healthcheck (via unix:///var/run/cilium/hubble.sock): Ok
    Current/Max Flows: 4,095/4,095 (100.00%)
    Flows/s: 4.07
Observing Traffic
To monitor all traffic in the cluster (similar to tcpdump), you can use the following command:
This shows the entire network traffic in the cluster in real time.
Sep  4 07:28:18.255: 10.100.2.60:48428 (host) -> 10.100.2.77:4240 (health) to-endpoint FORWARDED (TCP Flags: ACK, PSH)
Sep  4 07:28:18.256: 10.100.2.60:48428 (host) <- 10.100.2.77:4240 (health) to-stack FORWARDED (TCP Flags: ACK, PSH)
Hubble can filter traffic based on various criteria such as Pod labels, Namespaces, or DNS queries.
This command, for example, monitors all traffic of the Pod nginx-5f8f49fff4-m8m9h in the default Namespace, but ignores DNS queries.
Another common scenario is filtering by destination port:
This command outputs detailed network data in JSON format, e.g.:
{
  "flow": {
    "time": "2023-09-04T08:25:35.610232081Z",
    "uuid": "c488a8f9-1301-4490-84f1-7ed96afd36f3",
    "verdict": "FORWARDED",
    "IP": {
      "source": "10.100.3.241",
      "destination": "142.250.184.238",
      "ipVersion": "IPv4"
    },
    "l4": {
      "TCP": {
        "source_port": 33610,
        "destination_port": 80,
        "flags": {
          "SYN": true
        }
      }
    },
    "source": {
      "namespace": "default",
      "pod_name": "nginx-5f8f49fff4-m8m9h"
    },
    "destination": {
      "identity": 2,
      "labels": ["reserved:world"]
    },
    "traffic_direction": "EGRESS"
  },
  "node_name": "cl-cilium-15-jibbo4pnpgn7-node-1",
  "time": "2023-09-04T08:25:35.610232081Z"
}