Using the Prometheus One‑Click Feature
NETWAYS Managed Kubernetes® offers a one‑click integration of Prometheus.
The prerequisite is the Prometheus Managed Service, which can also be started in MyNWS.
Installation
To enable the Prometheus integration, go to MyNWS in the Kubernetes menu, open the cluster overview and select Enable Prometheus‑Agent from the context menu of the respective cluster.
This creates several workloads, services and configuration objects in the cluster in the Namespace saas‑prometheus‑agent:
kubectl get all -n saas-prometheus-agent

NAME                                                       READY   STATUS    RESTARTS   AGE
pod/prom-agent-saas-prometheus-agent-prometheus-0          2/2     Running   0          45m
pod/saas-prometheus-agent-operator-74cd9cd878-987bb        1/1     Running   0          45m
pod/saas-prometheus-agent-prometheus-node-exporter-6z4lp   1/1     Running   0          45m
pod/saas-prometheus-agent-prometheus-node-exporter-q88qf   1/1     Running   0          45m
pod/saas-prometheus-agent-prometheus-node-exporter-wtmb6   1/1     Running   0          45m

NAME                                                     TYPE        CLUSTER-IP       EXTERNAL-IP   PORT(S)             AGE
service/prometheus-agent-operated                        ClusterIP   None             <none>        9090/TCP            45m
service/saas-prometheus-agent-operator                   ClusterIP   10.254.186.253   <none>        443/TCP             45m
service/saas-prometheus-agent-prometheus                 ClusterIP   10.254.209.115   <none>        9090/TCP,8080/TCP   45m
service/saas-prometheus-agent-prometheus-node-exporter   ClusterIP   10.254.166.186   <none>        9100/TCP            45m

NAME                                                            DESIRED   CURRENT   READY   UP-TO-DATE   AVAILABLE   NODE SELECTOR            AGE
daemonset.apps/saas-prometheus-agent-prometheus-node-exporter   3         3         3       3            3           kubernetes.io/os=linux   45m

NAME                                             READY   UP-TO-DATE   AVAILABLE   AGE
deployment.apps/saas-prometheus-agent-operator   1/1     1            1           45m

NAME                                                        DESIRED   CURRENT   READY   AGE
replicaset.apps/saas-prometheus-agent-operator-74cd9cd878   1         1         1       45m

NAME                                                           READY   AGE
statefulset.apps/prom-agent-saas-prometheus-agent-prometheus   1/1     45m
After installation, the Prometheus agent automatically collects data:
- from the Kubernetes API
- from the cluster nodes
Via Remote Write it is also automatically connected to the Prometheus Managed Service.
Distinguishing multiple clusters
To differentiate metrics from different clusters, the Prometheus integration labels the collected data with a unique label in the form nws_cluster=<cluster-name>.
Visualization
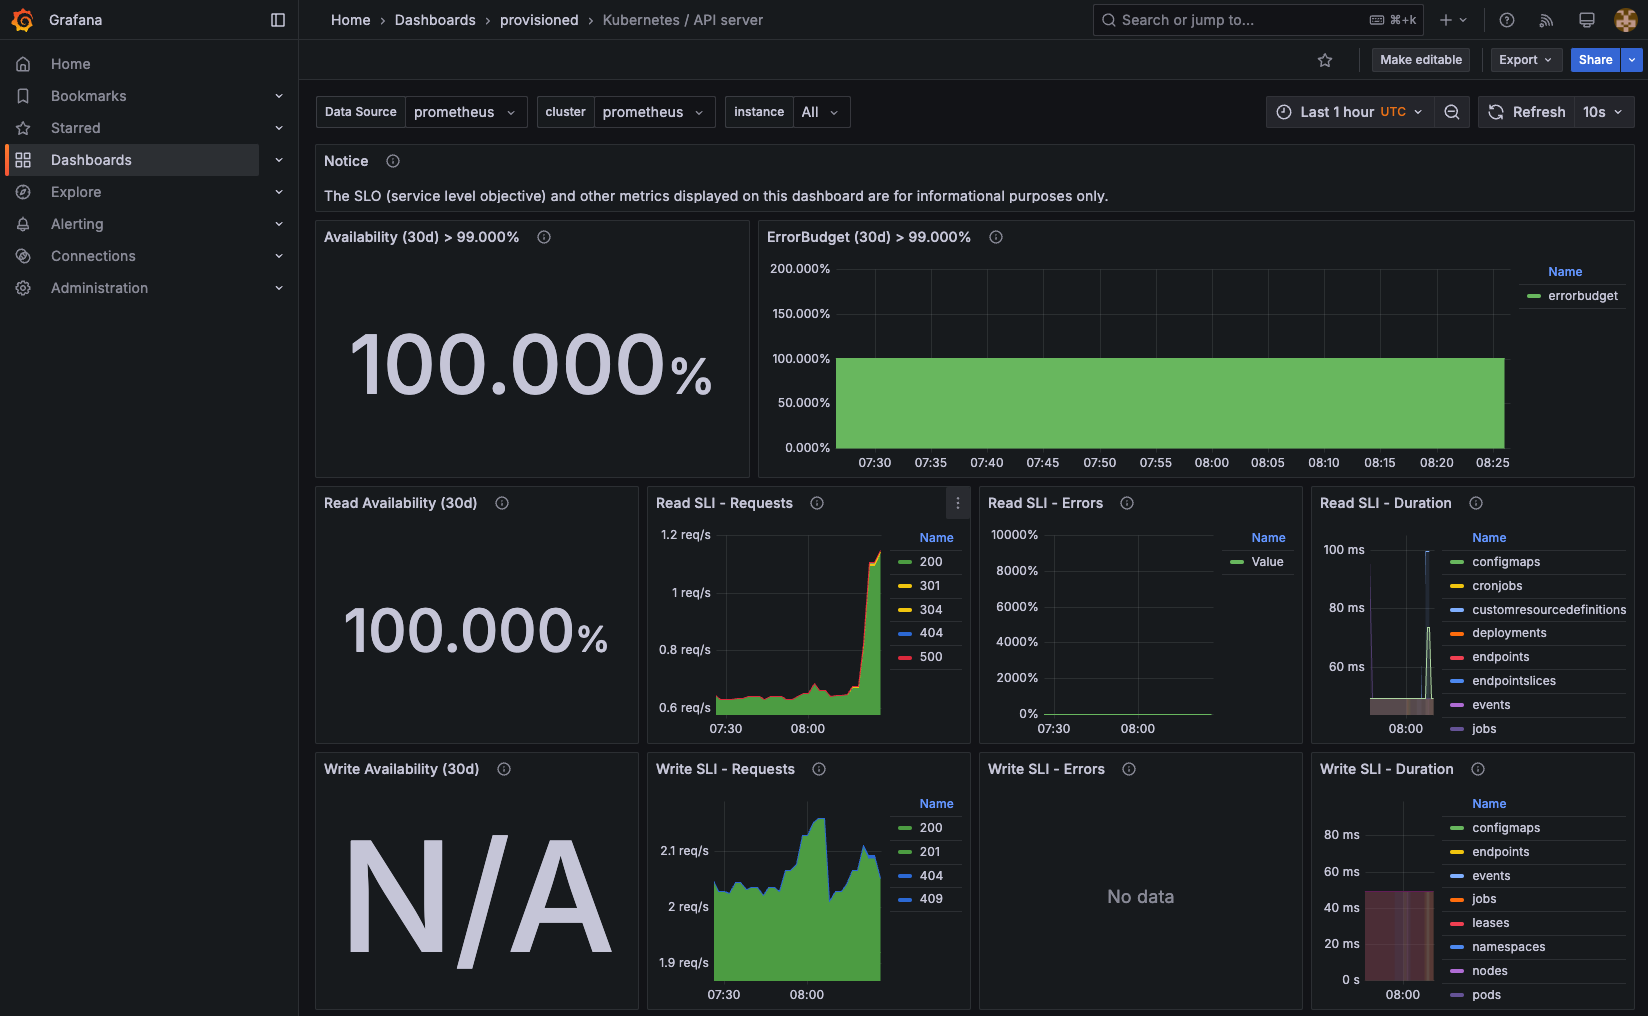
The collected data is automatically propagated via Remote Write to the existing Prometheus Managed Service and can be accessed in its Grafana instance.
For direct use of the collected metrics, several ready‑made dashboards are available in the provisioned dashboard folder:
General Kubernetes Dashboards
- API Server
- Kubelet
- Persistent Volumes
Compute Resources Dashboards
- Multi‑Cluster
- Cluster
- Namespace (Pods)
- Namespace (Workloads)
- Node (Pods)
- Pod
- Workload
Networking Dashboards
- Cluster
- Namespace (Pods)
- Namespace (Workload)
- Pod
- Workload
Adding Additional Endpoints
If you want to monitor additional endpoints in your clusters beyond the pre‑configured monitoring, you can set up so‑called Monitors for Pods and Services. For this, the Custom Resource Definitions PodMonitor and ServiceMonitor are installed in the cluster.
The Prometheus Operator installed in the cluster reacts to the creation of these custom resources in real time and updates the Prometheus configuration accordingly.
An example ServiceMonitor could look like this:
apiVersion: monitoring.coreos.com/v1
kind: ServiceMonitor
metadata:
  namespace: webapp-prod
  name: webapp-prod-monitor
spec:
  endpoints:
  - port: http
    scheme: http
  selector:
    matchLabels:
      app: webapp
This ServiceMonitor results in monitoring all Services in the webapp-prod Namespace that are labeled with app: webapp. The endpoint used is the port named http on the discovered services.
Services in different Namespaces
By default a ServiceMonitor only matches services in the namespace where it is defined. This behavior can be changed with a namespaceSelector:
A ServiceMonitor with this configuration would monitor all services in the namespaces webapp-prod and webapp-staging that have the labels defined in the selector.